In a previous post, I mentioned that we could use c code to analyze some shellcode currently being posted in the wild by malicious web site operators.
These malicious websites are delivering malware by exploiting several Windows based vulnerabilities. The websites attack visitors by targeting vulnerabilities in .ani file parsing, .wmf file parsing, and rtsp content-type string parsing in the QuickTime plugin.
In our labs, we visit these web sites with vulnerable systems, allowing the pages to compromise the systems. We then analyze the techniques being used. Let’s take a quick look at a major part of the attack — the shellcode within the delivered malformed wmf file. We’ll take a look at the low level data content of the malformed file itself:

After seeing a lot of these malformed files, you can spot the shellcode right away. I did in the above image after a quick visual scan, but sometimes details of the file format need to be known to find the shellcode on the first try.
We copy out the string of shellcode hex data into a c-style string, like this one:
“\x83\xec\x10\xd9\xee\xd9\x74\x24\xf4\x58\x33\xc9\xb1\xdb…”
I copy it into the buffer in the c file from the previous post, and the assignment will look like this:
unsigned char shellcode[] = “\x83\xec\x10\xd9\xee\xd9\x74\x24\xf4\x58\x33\xc9\xb1…”
I compile it using gcc, but you can use the cl.exe Microsoft compiler if you would like — whatever c compiler should be fine. I’ve never seen a problem with substituting one for another:
C:\sh\>gcc sh3ll.c -o sh3ll.exe
The compiler emits an expected warning that can be ignored, and now we have an executable to work with. We’ll run it in Olly to its entry point, and then search for the beginning of the shellcode string in memory. When we find it, we’ll set a memory access break point on that memory location and then let the process run to that point by hitting f9.
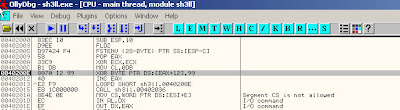
When the debugger arrives at this starting point for the shellcode, the debugger shows us a very strange listing — “jno” instruction followed by a bunch of “cnq” instructions? The listing looks very strange:

We hit f7 a few times and notice “xor byte ptr ds:[eax+12], 99″, followed by a loopd instruction that takes us back to a few lines prior. This loop is an xor decoder loop, implemented in this shellcode because we are exploiting BoF, and usually that means we are attacking a string handling flaw. Any “00″ or null bytes in the code will likely crash the code, as explained in chaps 3, 7, 9.
We also notice that ecx is set to “0xdbh” at 0040200e, meaning that this loop will decode the subsequent 219 bytes of data:
We can continue stepping through the code with f7, watching the decoding taking place, until ecx decrements to zero. When it finishes, we step through a bit more slowly.
Stepping into the instructions with f7 now reveals the code searching for kernel32’s location in the process space using the common and reliable technique of parsing the PEB and its module initialization linked lists. It then searches for LoadLibraryA, ExitThread, and WinExec win32 api calls. It loads urlmon and finds URLDownloadToFileA. These calls all tell us that this shellcode’s functionality is download and execute — and we can observe the url strings that the code is communicating with.
Download and execute shellcode like this happens to be some of the most prevalent shellcode that we see served up by malicious web sites.
Hope that you learned a few things about the sorts of techniques we can use to analyze shellcode and its behaviors. Let me know what you think of it!